by Pinchas Cohen
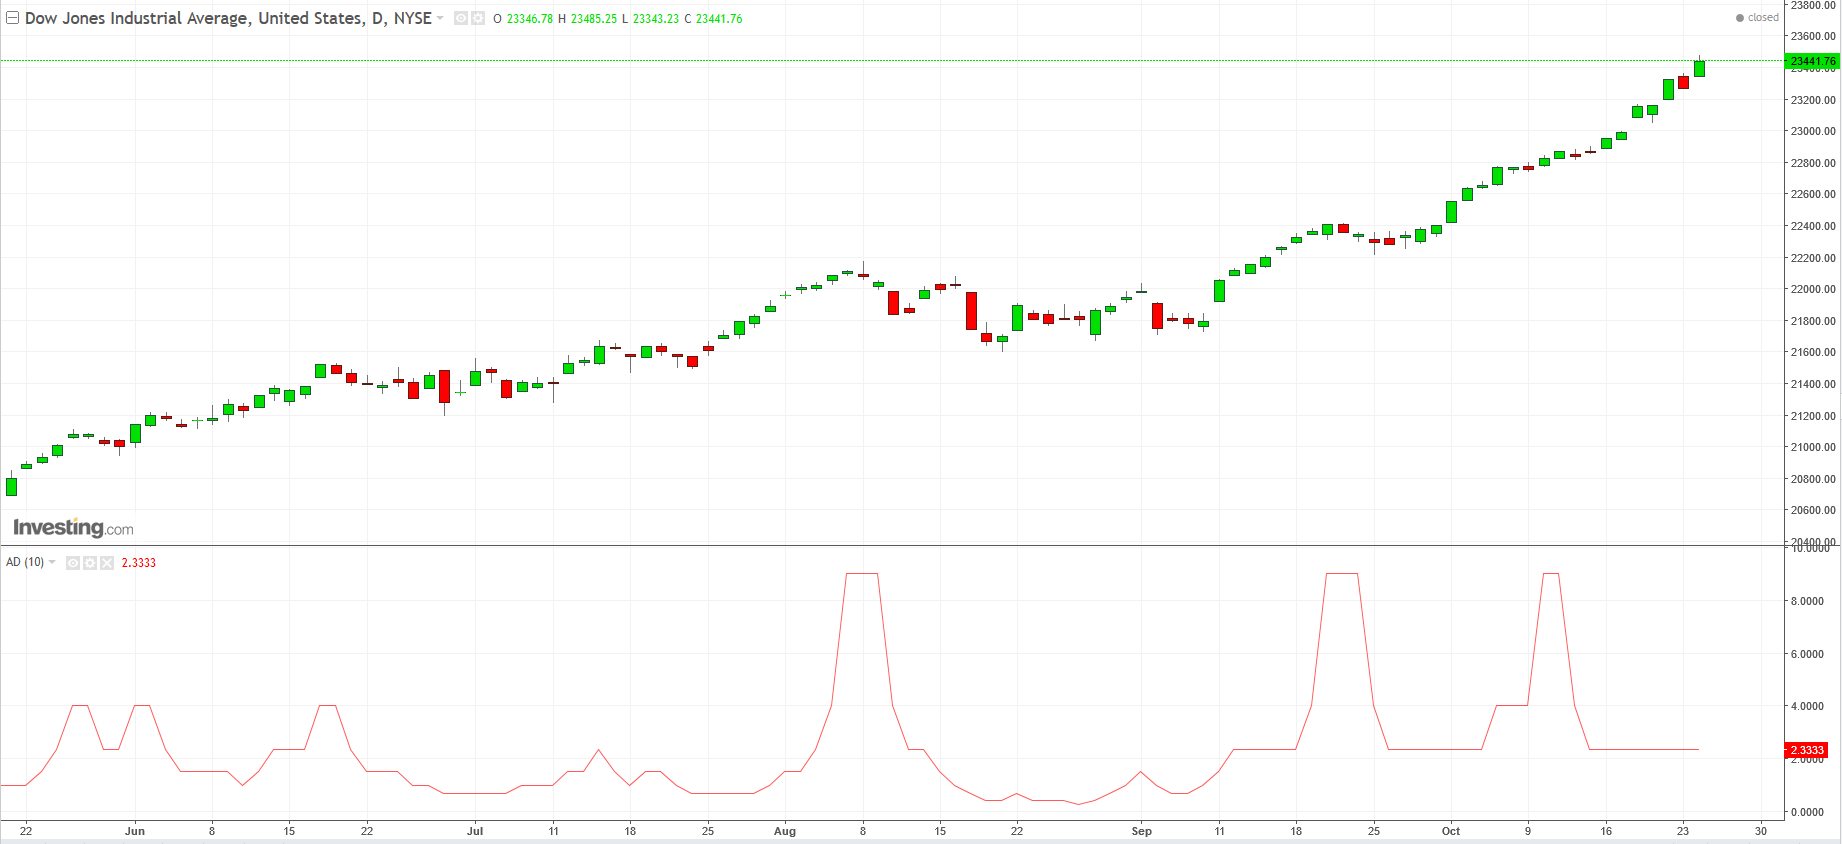
Yesterday the Dow Jones Industrial Average posted a new high, while other US indices closed without any new records set. It reached this new high courtesy of just two companies, Caterpillar (NYSE:CAT) and 3M (NYSE:MMM) which together make up almost 11 percent of the Dow 30 index.
Caterpillar shares soared yesterday on its strong earnings beat and yet another raised forecast, gaining more than 7%. The world's biggest construction and mining equipment maker reported a 25 percent jump in quarterly revenue. The company blew past Wall Street's profit and revenue estimates on surprisingly strong demand for its construction equipment in North America and robust sales in China. Caterpillar also raised its full-year forecasts for sales and earnings, with the expectation that revenue in its construction business will grow by 20 percent and its mining business will jump by 30 percent.
Also on Tuesday, 3M reported a third-quarter profit of $1.43 billion, with a net income of $2.33 per share. The results handily surpassed Wall Street expectations. The average estimate of eight analysts surveyed by Zacks was for earnings of $2.21 per share. The maker of industrial coatings, ceramics and Post-It Notes saw revenue of $8.17 billion in the period, also beating Street forecasts. Four analysts surveyed by Zacks expected $7.91 billion.
3M anticipates full-year earnings to be $9 to $9.10 per share. The company's stock has increased by 24 percent since the beginning of the year, while the S&P 500 has climbed just 15 percent. The stock has increased 31 percent over the last 12 months.
While positive earnings and revenue estimate beats confirm the global growth story, a lack of market participation may cause a correction before the next leg in the rally. An additional damper to the great news is the escalating war of words between US President Donald Trump and Republican Senator Bob Corker of Tennessee which has muddied the prospects for tax reform. As well, in a speech highly critical of Trump, Arizona Republican Jeff Flake announced he wouldn’t seek re-election to his Senate seat, raising further uncertainty about the tax overhaul’s fate.

The Advance Decline Line (AD) in the chart above is an indicator showing what the broader market, or average of all the stocks, is doing. As you can see, the broad market did not participate in the recent rally. The Dow is the only index to post new highs, and as discussed above, on just the movement of a pair of stocks. As such, its rally is suspect and could be unsustainable, providing no additional trading opportunities.
Global Financial Affairs
During times of uncertainty, investors prefer to park their capital in the presumed safety of US Treasuries. When the markets start roaring, investors rush to reinvest in risk assets such as equities. When investors sell Treasuries, the price falls, increasing the divergence between price and yield. Which makes yields rise.
The higher the yield, the more attractive to investors, whereupon demand raises the price, causing the yield to fall. This is how yields rise and fall, zig-zagging between the asset's attraction as a safe haven versus how much yield it pays investors.

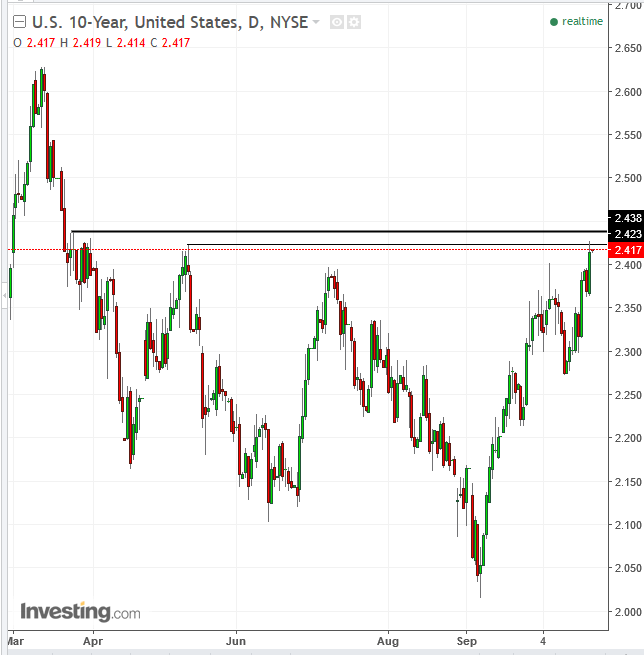
The inverse relationship between rising yield and price shows that investors have been dumping Treasuries. The yield on the 10-year note, above, has penetrated the May 11, 2.423 percent high on an intra-day basis, but closed beneath it, suggesting a resistance at this level. (The resistance is caused not by sellers, as it normally is with most assets, but by buyers—based on the price-yield inverse relationship—whose demand makes the difference between the price of the bond and the yield it pays smaller.)
The attraction of buyers at this level is a combination of the higher payout of the yield and a concern that the long all-time high stock spree makes equities too expensive and overdue for a correction. A close above the March 23, 2.418 level may signal a reversal in investor sentiment with regard to pursuit of growth and a shift in focus toward preserving capital during times of uncertainty or market declines.
The dollar closed yesterday at its highest level since the currency's July 25, 3-month high to the day. US earnings have thus far been confirming the narrative that the US economy is growing, even if at a moderate pace.
This will provide Fed Chair Janet Yellen the excuse she needs for another rate increase this year. We wrote earlier this year that Yellen missed her chance to raise rates when inflation was rising in 2016 and she’ll soon likely find herself in the tough spot of having missed her opportunity when inflation wanes. That’s been happening in 2017. She will, we noted, find herself in a position where she needs to raise rates more quickly than is optimum, almost nervously, before the economy flattens out again. Which has proven to be true.
As for the US dollar, fiat currencies are a symbolic unit of the economy they represent. Therefore, investor faith in a currency rises when its economy improves. With US economic expansion once again looking positive, demand for the dollar rises.

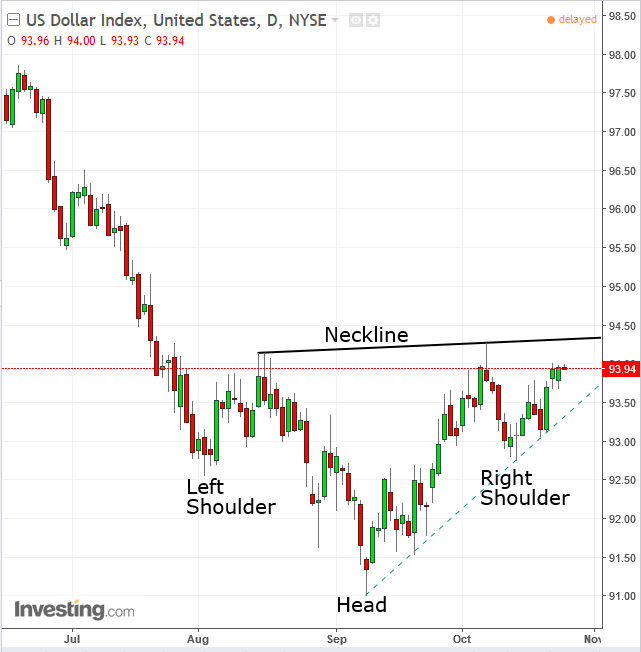
The dollar index has been forming a bottom reversal head & shoulders pattern. It demonstrates that the previous downtrend is turning and potentially reversing into an uptrend.
A reversal call may be made upon the crossing of the price above the neckline, which plots the former lows, completing the minimum required two highs and lows in an upward direction, the head being the first low and the right shoulder being the second, higher low, while the October 6 high is the first high and the new high, upon the penetration of the neckline, being the second, higher high.
Despite the dollar maintaining its gains, the euro strengthened on companies in the euro-area expanding as growth picks up. The composite Purchasing Managers’ Index (PMI) for manufacturing and services fell to 55.9 in October from 56.7 in September, which is higher than the 56.5 predicted.
This read is bullish for eurozone economic growth for two reasons:
- Any number above 50 means the economy is expanding.
- The monthly expansion was better than expected.
Bottom Line: companies expanded workforces at the sharpest pace in more than a decade.

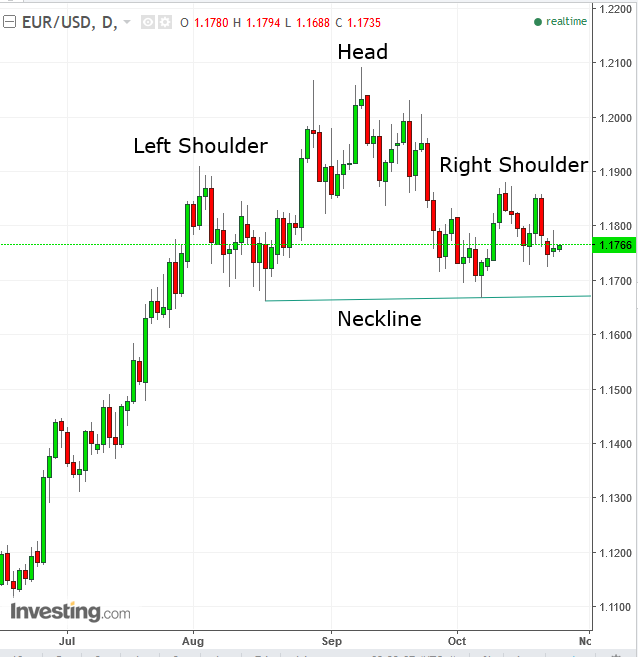
The EURUSD is a mirror image of the dollar index, which makes sense given the euro is the largest currency, by far, in the basket that makes up the dollar index, with a weight of 57.6. The second largest currency in the basket, the yen, makes up a relatively paltry portion of the basket, a mere 13.5 percent, less than a quarter of the euro’s weight.
The Head & Shoulders pattern top demonstrates an interruption in the previous uptrend. The potential for a reversal may be called upon a decisive breakdown of the neckline, which would constitute two highs and lows in a downward direction. In that case, the head would be the first high, the right shoulder would be the second, lower high, while the second low of the neckline, registered on October 6 with a low of 1.1668, would make up the first low and the neckline penetration would constitute the second, lower low.
Despite a fresh Dow record yesterday and the weakest yen since July 12, which normally boosts Japanese stocks on expectations of higher exports and cheaper stocks for foreign investors, this morning the Nikkei 225 ended its breathtaking 16 day streak of continuous advances. It may be a sign of the lack of broad market participation that was seen yesterday.
This lack of participation and indeed today’s outright equity stall-out—on a global scale—coincides with Treasury yields reaching a key level, which has proved to be a resistance since May 11.
The Stoxx Europe 600 Index was dead in the water earlier today, as European earnings ran out of steam.
Confirming the global bearish sentiment,S&P 500 futures dropped, after paring a portion of Monday’s declines. Still, Treasury yields maintained gains, even if advances were stalled on a resistance level. Presumably yesterday’s impressive corporate results gained traction for equities and investors aren't planing to rush back into Treasuries and other havens.
Currencies are ranging, as investors await two upcoming catalysts: tomorrow’s ECB meeting where the central bank is expected to announce a reduction in bond buying. It's the most high profile, scheduled event this week, unless President Donald Trump’s Fed Chair nomination is finally revealed.
On the heels of positive earnings leading equities to ever higher highs, the upcoming US GDP reading on Friday will paint a broader picture, confirming or denying economic growth over the last quarter.
Up Ahead
- South Korea reports on GDP today and Hong Kong on imports and exports tomorrow, Japan reports on CPI tomorrow as well.
- Major tech companies reporting earnings tomorrow week include Alphabet (NASDAQ:GOOGL), Microsoft (NASDAQ:MSFT) and Twitter (NYSE:TWTR).
- The week also brings rate decisions from the Bank of Canada, Norway's Norges Bank and Sweden's Riksbank.
Market Moves
Stocks
- Japan’s Topix index fell 0.3 percent and the Nikkei 225 declined 0.5 percent at the end of trading in Tokyo. Australia’s S&P/ASX 200 Index rose 0.1 percent while South Korea’s Kospi index was up 0.2 percent. The Hang Seng Index climbed 0.4 percent, while the Shanghai Composite Index gained 0.2 percent. India’s Sensex advanced 1 percent.
- The Stoxx Europe 600 Index increased less than 0.05 percent as of 8:35 a.m. London time.
- The MSCI All-Country World Index climbed less than 0.05 percent.
- The U.K.’s FTSE 100 Index declined 0.1 percent to the lowest in more than a week.
- Germany’s DAX Index rose 0.1 percent to the highest in a week on the biggest advance in a week.
- The MSCI Emerging Market Index climbed 0.3 percent, the largest increase in more than a week.
- Futures on the S&P 500 Index fell 0.1 percent.
-
Currencies
- The Dollar Index is flat, at 93.94, its highest since October 6.
- The euro decreased less than 0.05 percent to $1.1759.
- The Japanese yen increased less than 0.05 percent to 113.88 per dollar.
- The British pound declined less than 0.05 percent to $1.3129, the weakest in almost three weeks.
Commodities
- Gold dipped 0.3 percent to $1,272.93 an ounce, the weakest in almost three weeks.
- West Texas Intermediate crude decreased 0.2 percent to $52.34 a barrel.
- Copper fell 0.9 percent to $3.17 a pound, the biggest drop in more than a week.
- LME zinc declined 0.5 percent to $3,161.00 per metric ton, the largest drop in more than a week.
Bonds
- The yield on 10-year Treasuries climbed less than one basis point to 2.42 percent, the highest in about seven months.
- Germany’s 10-year yield dipped one basis point to 0.47 percent.
- Britain’s 10-year yield declined one basis point to 1.349 percent.
